當你的服務只跑在一台機器上,出問題就 SSH 上去看 log。但當服務散在五台、十台、五十台機器上呢?你要 SSH 到每一台去 grep 嗎?
先講結論
多節點監控的核心就三個字:集中化。Metrics、Logs、Traces 三件套缺一不可,但比工具更重要的是標準化——如果每台機器的指標格式都不一樣,你集中了也看不懂。告警要少而精,告警太多就等於沒有告警。
為什麼單機思維會害死你
我曾經在一個五台 Node 的叢集裡排障。其中一台的 CPU 飆到 100%,但我們的監控只看平均值——五台平均下來才 40%,完全不會觸發告警。結果那台機器上的服務開始 timeout,影響到整個系統。
多節點環境的典型問題:
- 每台各自有 log,但問題可能跨越多台
- 一台機器掛了,平均指標把問題淹沒
- 告警太多,值班的人直接把通知靜音
你需要一個全局視角,而不是 N 個獨立視角。
Metrics、Logs、Traces 缺一不可
這三樣東西解決不同的問題:
Metrics 告訴你「發生了什麼趨勢」——CPU 在升、QPS 在降、延遲在漲。它是你的儀表板。
Logs 告訴你「具體發生了什麼」——哪個 request 失敗了、錯誤訊息是什麼。它是你的偵探筆記。
Traces 告訴你「這個 request 經過了哪些服務、每段花了多久」。它是你的 X 光片。
少了 Metrics,你不知道出了問題。少了 Logs,你知道出問題但找不到原因。少了 Traces,你找到原因但不知道瓶頸在哪段。
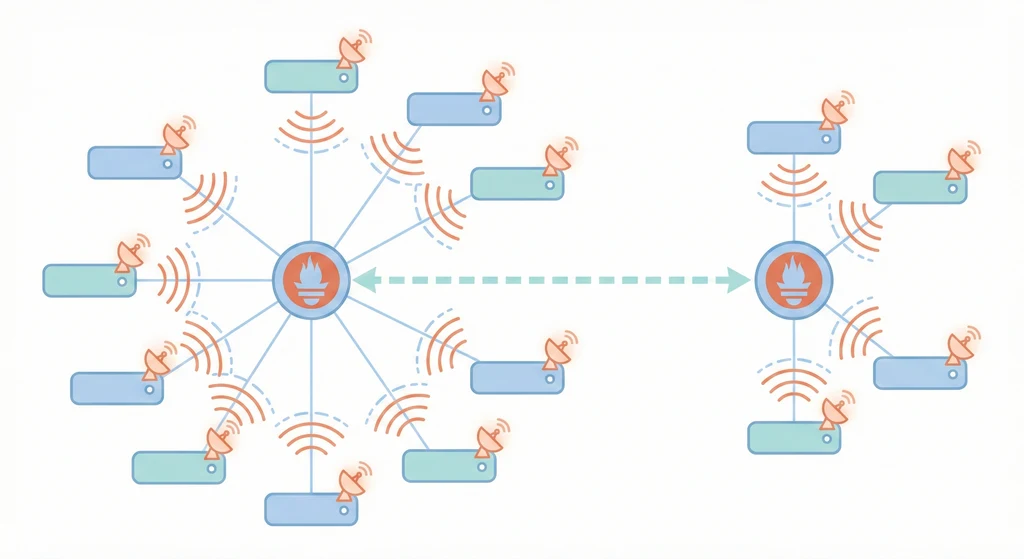
Prometheus + Grafana:最常見的組合
不是因為它最好,而是因為它最成熟、社群最大、坑最少。
每台機器裝一個 Node Exporter,Prometheus 定期去拉指標,Grafana 負責視覺化。
# Prometheus scrape config
scrape_configs:
  - job_name: 'node'
    static_configs:
      - targets: ['10.0.0.1:9100', '10.0.0.2:9100']
    labels:
      env: 'prod'
      service: 'api'
重點是 label 要統一。env、service、instance 這些標籤要有標準命名,不然你在 Grafana 上根本沒辦法做聚合查詢。
告警治理:少就是多
告警設計最常犯的錯是「什麼都告」。CPU 超過 70% 告一次、80% 再告一次、90% 又告一次。結果值班的人每天收到三百則通知,直接免疫。
好的告警應該:
- 綁定 SLO——不是「CPU 高了」,而是「錯誤率超過 SLA 承諾」
- 能行動——收到告警之後,我知道要做什麼
- 附 runbook 連結——不要讓被叫醒的人還要自己查文件
- alert: HighErrorRate
  expr: rate(http_requests_total{status=~"5.."}[5m]) > 0.05
  for: 10m
  labels:
    severity: page
  annotations:
    summary: "5xx 錯誤率過高"
    runbook_url: "https://wiki.internal/runbook/high-error-rate"
如果你的告警沒有 runbook,那它就只是噪音。
不要忽略外部視角
你的內部指標全部正常,但使用者說網站打不開——這種事發生過嗎?
那是因為你只看了「內部指標」,沒有做 Blackbox monitoring。從外部打 HTTP 健康檢查、量端到端延遲、驗證 DNS 解析是否正常。
即使你的 Prometheus 全掛了,外部監控仍然能告訴你「服務是不是活的」。
延伸閱讀
監控系統最諷刺的地方是:當你最需要它的時候,它可能也一起掛了。所以,記得監控你的監控。